

What is Product Adoption?
Developing a software, or creating a product and penetrating into the market is the first step. I believe you’ve already convinced a bunch of users why you can solve issues that their long-term existing platforms cannot. And now that the user has clicked on your website and downloaded your app, how do you plan on retaining them?
And more importantly how do you plan on understanding where their pain points lie without talking to every single user?
I have a solution to this: By measuring the product adoption rate for your platform,
Before we get into the nitigrities of the above said title, let’s decode the product adoption process. Visualise this: you develop a software and with a classic game plan, penetrate into the market, and then what?
There are thousands of blogs on the internet teaching you how to do the first two but there are equally fewer items on the internet that tell you how to stay in the market. The easiest and quickest solution off the bat of my head is, knowing your problem areas and fixing them as and when required for the customers. But how does one know their problem areas?
This brings us to our next step- get feedback on what is working and what is not, what all needs to be updated, etc. After all, what worth is any invention if not customer-centric? On top of that, how does one really know if the bandwidth utilized towards one feature is worth the money and time or/and something else need to be inculcated to reach optimum utility? While customer feedback via forms, social media, and CTAs work well, how does one interpret these?
Why should you measure Product and user adoption?
This again brings us to our next step: decoding the customer feedback. Forms, word of mouth, and social media CTAs will highlight the pain points. But you cannot find a strategic solution to something you cannot measure. This an unpopular opinion but words only help in customer acquisition, nothing covers customer retention like numbers. And this is what we’re going to do moving forward in this blog. We will do a product adoption analysis using the customer success adoption metrics. With a brand as big as yours, a hit-and-miss isn’t really the right approach for a long-term solution to consistently improve customer onboarding and retention. That’s when metrics and KPIs come into the picture.
If a customer has signed up for your product but isn’t really using the services, some of the key features, or how to engage the user to an extent where it’d commit to their loyalty so that it becomes invariably proportional to the success of the business metric – That’s why you need to start focusing on adoption improvement.
To utilize the data received primarily and/or via secondary sources, we have curated a list of 12 life-changing product and customer adoption metrics to measure user success.
Product adoption is measured after a user performs a certain action. However, that action varies from platform to platform. The action should show that the user is getting value from your product. quoted from whatfix.
12 most important product and user adoption metrics/KPIs to be used for tracking:
1. Product adoption rate
Mostly referred to as user adoption rate, it happens when a user starts utilizing the product as intended. Meaning, that let’s say a user enrolls for your services but once signed up, they never log back into your platform or app. Although they are still a user they will not be considered as a cohort that has adopted the product because technically they aren’t using the product. Product adoption rate is the number of users who adopt your software compared to the total number of signups or new users within a specific timeframe.
To find your product adoption rate, use the following formula:

2. Feature Adoption rate
Similarly to the product adoption rate, feature adoption rate refers to a user that is actively using a certain feature of your product. It can be calculated for multiple features across the same platform. It is highly beneficial to figure out the best-selling feature of your product and also works as a constructive metric to work on the features that aren’t attracting a user. The formula for finding the feature adoption rate is similar to the product adoption rate. It looks like this:

3. Time-to-Value
There isn’t a clear set metric to measure this per se. But it is the time difference between the moment a user signs up for your platform and the period where the user starts getting the return on their time and investment from your product. It differs from product to product, and with the attention span of the user being minimal, it is highly recommended to act fast on decreasing the gap between these two. The reason is, if the difference is too long, the user is most likely not receiving expected returns and hence might move to some competitor product. But if the difference is less, it means the user is attaining maximum benefit from your product and is most likely to end up as a loyal customer with a good retention rate.
4. Time to first action
To measure this, you must first pin down the action you are measuring. It can be any feature or function that you have recently launched. Or it could be just to analyze the maximum engagement for a certain feature or function. This means it measures the time it takes for a new user to initiate or engage in a particular feature. To use this metric, all you have to do is calculate the percentage of users who performed the key action for the first time divided by the total number of new signups.
5. Onboarding completion rate
To strategize your onboarding process for smooth user enrollment to your product, the onboarding completion rate is helpful. It measures the number of users who have successfully reached the end of the onboarding process. It helps in finding the flaws in the entire process and hence results in product adoption efficiency by figuring out the pain points for the user, helping in consistently improving the onboarding process user friendly.
You can use the following formula to find your user onboarding completion rate:

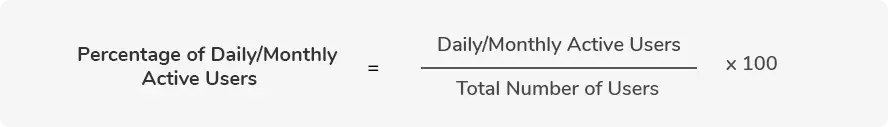
6.Percentage of Daily/Monthly Active Users
This metric helps you identify how many users are actively engaged in your product at a specific time. The time frame, in this case, can be daily or monthly. Daily active users (DAU) measure the number of users who are gaining benefits from your product and hence might also have their loyalty towards your product. Monthly Active Users (MAU) help measure the monthly traffic of your platform. It is typically used for the measurement of factors that do not have any direct impact on your daily engagement rate.
7. Average Usage Frequency
This metric is used to measure the product usage of individual users rather than the whole cohort for a time frame. Let’s say a user signs up for your platform/product and has been frequently engaging with your product in the initial days but their log-in has reduced drastically in the last few weeks, it means that either they have effectively reaped the benefits of your product to the optimum. Or, have moved to a competitor. Average Usage frequency calculates how often a specific account is used. This is very much like DAU or MAU but instead of focusing on the entire user base as a whole, it focuses on single users.
8. Average time spent using the product/feature
Quite similar to the usage frequency metric, it measures the amount of time a user spends on any particular feature/ function of your platform or product. This is significant to identify which feature is the most benefitting one for your user and also the areas that need to be consistently worked upon. This metric can help you understand how many users are utilizing your product.
Schedule a demo with one of our experts to take a deeper dive into Churn360
Book a demo
9. Net Promoter Score
The best metric that helps predict business growth, Net Promoter Score not only helps you lets you calculate the percentage of your customers who have adopted your product, but it also targets those users that will most likely recommend it to others.
Example: To calculate your NPS, you’ll need to survey users with the following question: How likely would you recommend [platform/product] to a friend or colleague?
You’d then ask your users to rate their likelihood on a scale of 1-10. Scores between 0-6 are considered Detractors, while scores 9-10 are Promoters and 7-8 are Passives. Subtract the percentage of Detractors from the percentage of Promoters to find your NPS. Scores can range from -100 to 100. Hence, lets you measure the satisfaction of these customers with your product and gives you the opportunity to engage with users that have different scores.
10. Upsell rate
Upselling or cross-selling upgrades is an effective way to measure customer engagement with your product. A user will not buy or upgrade to additional services if he/she is not satisfied with whatever you are offering. The best way to utilize this metric is by segregating users into particular segments as per certain criteria.
And then calculating the upsell rate using this formulae:

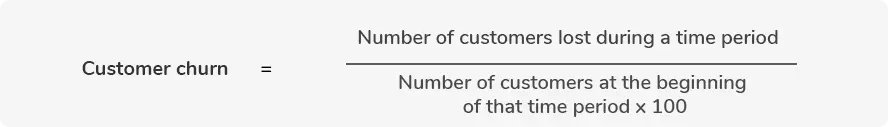
11. Churn rate
Customer churn rate refers to the number of customers or users who have stopped using your product or platform during a specified time period. For example, let’s say you have successfully onboarded 100 users at the beginning of the month but by the end of the month, you’re left with 80 users. In this case, your churn rate is 20%. It is beneficial for the sustainable growth of the company to know how well it is retaining a customer despite how many new users join the line.
To find customer or user churn, use the following formula:
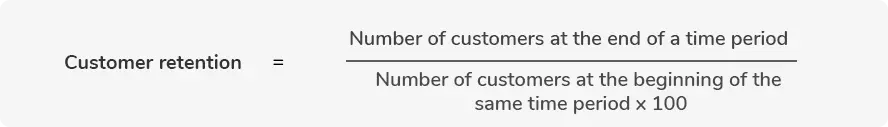
12. Customer Retention rate
The formula you use to find user retention is similar to the formula to find the churn rate. It measures the number of users who have successfully become a part of your platform/product. Taking the above example, the retention rate for the month will be 80%. Meaning, the customer retention rate is the flip side of churn rate.
You can calculate the customer retention rate using this formulae:
Conclusion
Creating a product is only the first step of the road map to building a loyal user base that not only adds to product adoption but also brings in new users. Though product adoption is not going to surge overnight but with the right metrics, it is easy to find out ways how to consistently improve the user experience. However, every product/platform is different and it becomes overwhelming to decide which metrics will work for you.
Hence it becomes extremely significant in choosing the right metrics for your platform to give the best results. Making data-driven decisions not only results in business growth but also helps you refine the customer experience by targeting the right KPIs.


